Đào tạo & nghiên cứu
Research to Construct the Process for Detecting African Swine Fever Virus (ASFV) from Different Samples Using Real-time PCR Technology
Quoc V. Nguyen [1,2], Tan T. Nguyen [1,2], Duy K. Tran [1,2], Quang D. Ha [1,2],
Nhu H. T. Tran [1,2], Thao H. T. Nguyen [1,2], Anh H. Pham [1,2],
Huong T. Pham [1,2], Van H. Pham [2,3]
[1] Nam Khoa Biotek Co. Ltd., Vietnam
[2] Vietnam Research and Development Institute of Clinical Microbiolgy, Vietnam
[3] Phan Chau Trinh University, Vietnam
|
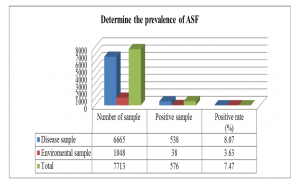
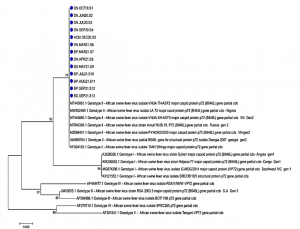
Background African Swine Fever (ASF) is a high mortality rate epidemic that leads to severe economic damage and a lack of worldwide food supplies. No vaccine or drug is available to treat ASF. Hence, real-time PCR tests could be an important tool for supporting the country’s disease prevention. Aim of the study Construct the process for detecting African Swine Fever Virus (ASFV) on different samples Materials and methods A real-time PCR reaction was conducted in this study using the OIE-recommended primer pair to amplify the VP72 gene, while the White Spot Syndrome Virus-specific primer was used as an internal control. Testing of this developed real-time PCR on different samples to detect the sensitivity and the specificity. Results and discussions The obtained parameters indicate that the sensitivity is 1,854 copies per reaction (95% CI: 1,073–3,205), the specificity is 100%, the repeatability is good, and the reproducibility has a coefficient of variation of 10%; PCR inhibition was avoided. Infection rates of ASFs were observed on 7713 samples for 7.47% (538/6665 ASF-positive samples represented 8.07%, and 38/1048 farm-related samples demonstrated a 3.63% infection rate). We also sequenced 13 positive samples of ASFV using DNA sequencing and found that all these samples belonged to genotype II strains. Conclusion With the developed real-time PCR for detecting of the ASFV from different samples, the control of the ASFV can be done in any laboratories that had the real-time PCR facilities in Viet Nam. Keywords: ASFV, Real-time PCR |
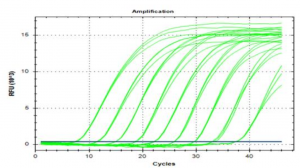
Graph 1: Amplification chart of the ASFV positive controdilution series with concentrations ranging from 100 to 108 copies/reaction
Graph 2: Results of determining the prevalence of ASF from the tested samples
Graph 3:Molecular phylogenetic tree built from 13 ASFV positive samples (blue circle) using MEGA 7 software using the Maximum Likelihood Method, checking repeatability with Boostrap 1000
|
REFERENCES
- Carlson et al., “Stability of African swine fever virus in soil and options to mitigate the potential transmission risk,” Pathogens, vol. 9, no. 11, p. 977, 2020, doi:https://doi.org/10.3390/pathogens9110977
- Bergmann et al., “A review of environmental risk factors for African Swine Fever in European wild boar,” Animals, vol. 11, no. 9, p. 2692, 2021, doi: https://doi.org/10.3390/ani11092692
- Mazur-Panasiuk et al., “African swine fever virus–persistence in different environmental conditions and the possibility of its indirect transmission,” Journal of veterinary research, vol. 63, no. 3, p. 303, 2019, doi: https://doi.org/10.2478/jvetres-2019-0058
- T. A. Mai et al., “Molecular profile of African swine fever virus (ASFV) circulating in Vietnam during 2019-2020 outbreaks, ” Archives of Virology, vol. 166, no. 3, pp. 885-890, 2021, doi: 10.22541/au.164866541.17842736/v1
- E. Sun et al., “Genotype I African swine fever viruses emerged in domestic pigs in China and caused chronic infection,” Emerging microbes & infections, 10, no. 1, pp. 2183-2193, 2021, doi:https://doi.org/10.1080/22221751.2021.1999779
